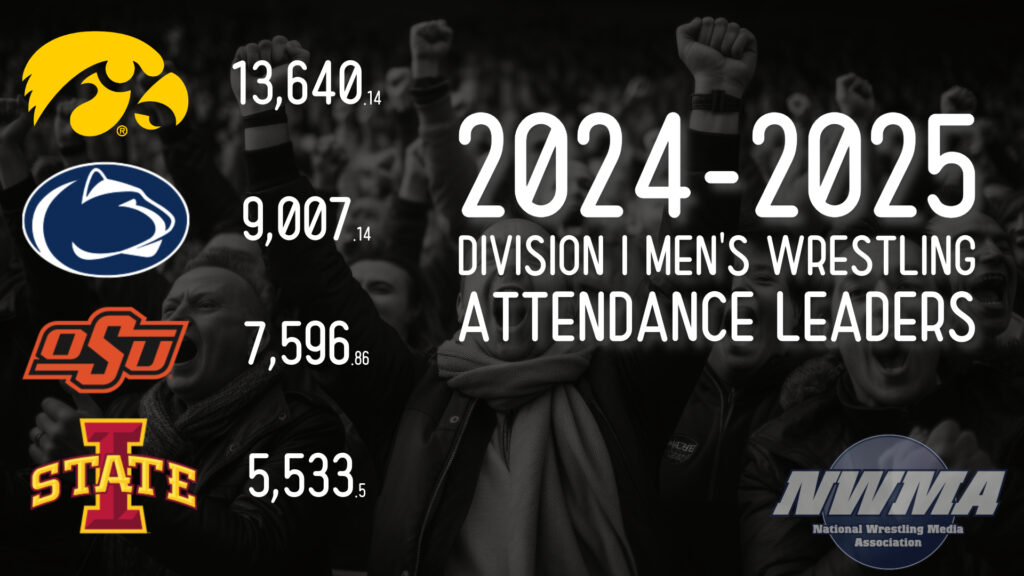
New Brighton, Minnesota – The University of Iowa once again led the nation in NCAA Division I men’s wrestling attendance, averaging 13,640 fans per dual across seven home meets, as the National Wrestling Media Association released its annual attendance report on Thursday.
Iowa drew a capacity crowd of 14,897 twice last season, filling Carver-Hawkeye Arena for duals against rivals Iowa State and Oklahoma State.
Penn State ranked second, drawing an average of 9,007 fans, including a season-high 15,998 for its dual with Iowa. That figure ties the indoor attendance record Penn State set in 2018 and matched in 2023 at the Bryce Jordan Center.
Oklahoma State moved up one spot from last season to finish third with an average of 7,597, highlighted by a crowd of 10,740 against Missouri. The David Taylor effect was clearly evident, as this marked the program’s highest home attendance average at Gallagher-Iba Arena since record-keeping began in 2002. The previous high average was in 2019 (5,226.6).
There were 10 duals with over 10,000 fans nationwide, marking the first time in recorded history there were at least 10 duals surpassing five figures. Iowa’s Carver-Hawkeye Arena hosted seven duals surpassing 10,000, while Penn State’s Bryce Jordan Center hosted two and Oklahoma State’s Gallagher-Iba Arena had one. The previous high for most duals with over 10,000 fans in a season is nine, set in 2023 and tied in 2024.
Of the 127 Division I men’s duals with over 10,000 fans historically, more than half (67) have come in the last 12 college wrestling seasons. There were no attendance records kept for the 2020-21 season.
Iowa State, which ranked third last season, slid to fourth but still drew over 33,000 total fans. The Cyclones averaged 5,533.5, with a high of 9,470 coming against Oklahoma in a co-hosted event with the Iowa State gymnastics team at Hilton Coliseum. Rutgers continued its reputation for lively home duals, jumping from ninth to fifth with an average of 4,228, including 8,097 fans for its home dual against Penn State.
The closure of historic West Gym forced Northern Iowa to move its home duals to the McLeod Center, resulting in an attendance surge that propelled the Panthers into the top 10. UNI leaped from 12th to sixth with a school-record average of 4,222. Ohio State improved slightly from eighth to seventh, averaging 3,975 at the Covelli Center. Nebraska climbed from 11th to eighth, averaging 3,817.5, with a high of 6,661 at the Devaney Center against Iowa.
Virginia Tech made a notable jump from 14th to ninth with one of the strongest seasons in program history. The Hokies drew over 1,000 fans at each of their five home duals, including a school-record 6,104 at Cassell Coliseum for their rivalry match with NC State. Minnesota rose from 13th to 10th, averaging 3,299.83, with a high of 5,307 at Maturi Pavilion against Iowa.
Road Draws
Iowa was the top road draw more than any other program, serving as the highest-attended visiting team at seven different schools. This continues a long-standing trend of Iowa not only leading in home attendance but also generating the largest crowds on the road. Ohio State, Oklahoma State, and Minnesota each served as the top draw at four venues, while Penn State was the biggest draw at three venues.
Doubling Up
Central Michigan, Iowa State, and Northern Illinois saw their biggest crowds this past season at combined events, pairing dual meets with women’s gymnastics competitions. Northern Illinois was involved in two such events, hosting over 1,000 fans for a dual against Buffalo while women’s gymnastics took on Kent State. The Huskies were also the visiting team at Central Michigan, where the Chippewas drew over 1,400 fans while women’s gymnastics faced Bowling Green. Iowa State drew over 9,000 against Oklahoma while its women’s gymnastics team competed against Simpson.
Figuring It Out
Six schools increased their average home dual attendance by 1,000 or more fans: Penn State, Lehigh, Virginia Tech, Northern Iowa, and North Carolina. A total of 155 duals drew more than 1,000 fans, one below last season’s total. A record-tying 27 schools averaged over 1,000 fans per dual. Lehigh led all non-Power 4 conference programs with an average of 3,223, boosted by a crowd of 9,769 at the PPL Center in nearby Allentown, Pennsylvania.
Full Attendance Listings:
| Rank | School | AVG | TOTAL | Dates | 1K+ | Best | Top Draw | 2023-24 Rank |
| 1 | Iowa | 13,640.14 | 95,481 | 7 | 7 | 14,847 | Iowa State, Oklahoma State | 1 |
| 2 | Penn State | 9,007.14 | 63,050 | 7 | 7 | 15,998 | Iowa | 2 |
| 3 | Oklahoma State | 7,596.86 | 53,178 | 7 | 7 | 10,740 | Missouri | 4 |
| 4 | Iowa State | 5,533.50 | 33,201 | 6 | 6 | 9,470 | Oklahoma (B&B) | 3 |
| 5 | Rutgers | 4,228.00 | 25,368 | 6 | 6 | 8,097 | Penn State | 9 |
| 6 | Northern Iowa | 4,222.00 | 25,332 | 6 | 6 | 7,348 | Iowa State | 12 |
| 7 | Ohio State | 3,975.00 | 27,825 | 7 | 7 | 4,626 | Minnesota | 8 |
| 8 | Nebraska | 3,817.50 | 22,905 | 6 | 6 | 6,661 | Iowa | 11 |
| 9 | Virginia Tech | 3,490.80 | 17,454 | 5 | 5 | 6,104 | NC State | 14 |
| 10 | Minnesota | 3,299.83 | 19,799 | 6 | 6 | 5,307 | Iowa | 13 |
| 11 | Lehigh | 3,223.60 | 16,118 | 5 | 5 | 9,769 | Penn State | 17 |
| 12 | Michigan | 2,971.17 | 17,827 | 6 | 6 | 6,459 | Ohio State | 7 |
| 13 | NC State | 2,530.40 | 12,652 | 5 | 5 | 2,933 | Pittsburgh | 6 |
| 14 | Oregon State | 2,116.17 | 12,697 | 6 | 6 | 4,273 | Iowa | 5 |
| 15 | Indiana | 2,109.67 | 6,329 | 3 | 3 | 2,765 | Ohio State | 16 |
| 16 | Missouri | 2,030.00 | 12,180 | 6 | 6 | 4,655 | Cornell | 10 |
| 17 | South Dakota State | 1,964.17 | 11,785 | 6 | 6 | 3,284 | Minnesota | 20 |
| 18 | Utah Valley | 1,863.50 | 11,181 | 6 | 6 | 5,053 | Oklahoma State | 25 |
| 19 | Army West Point | 1,805.00 | 3,610 | 2 | 2 | 2,452 | Navy | - |
| 20 | Wisconsin | 1,704.00 | 8,520 | 5 | 5 | 2,840 | Iowa | 15 |
| 21 | North Carolina | 1,652.20 | 8,261 | 5 | 5 | 3,026 | NC State | 41 |
| 22 | Arizona State | 1,529.80 | 7,649 | 5 | 4 | 1,919 | Oklahoma | 19 |
| 23 | West Virginia | 1,460.67 | 8,764 | 6 | 4 | 2,220 | Pittsburgh | 18 |
| 24 | Northern Colorado | 1,274.60 | 6,373 | 5 | 2 | 2,475 | Missouri | 37 |
| 25 | Purdue | 1,237.50 | 4,950 | 4 | 1 | 3,504 | Indiana | 45 |
| 26 | Pittsburgh | 1,160.29 | 8,122 | 7 | 5 | 1,663 | Ohio State | 21 |
| 27 | Cornell | 1,053.33 | 6,320 | 6 | 3 | 1,984 | Buffalo | 26 |
| 28 | Oklahoma | 975.50 | 5,853 | 6 | 1 | 2,348 | Oklahoma State | 22 |
| 29 | Maryland | 972.33 | 5,834 | 6 | 1 | 1,938 | Iowa | 35 |
| 30 | Cal Poly | 966.14 | 6,763 | 7 | 3 | 1,932 | Stanford | 28 |
| 31 | Lock Haven | 906.00 | 5,436 | 6 | 1 | 1,013 | Wisconsin | 27 |
| 32 | Illinois | 810.00 | 4,050 | 5 | 1 | 2,136 | Penn State | 32 |
| 33 | Wyoming | 782.20 | 3,911 | 5 | 0 | 907 | West Virginia | 33 |
| 34 | Princeton | 779.17 | 4,675 | 6 | 1 | 1,762 | Rutgers | 43 |
| 35 | Penn | 727.25 | 2,909 | 4 | 0 | 861 | Lehigh | 29 |
| 36 | Appalachian State | 721.71 | 5,052 | 7 | 0 | 920 | Campbell | 40 |
| 37 | Central Michigan | 710.83 | 4,265 | 6 | 2 | 1,461 | Northern Illinois (B&B) | 34 |
| 38 | Cleveland State | 692.67 | 4,156 | 6 | 1 | 2,400 | Kent State | 49 |
| 39 | Little Rock | 653.40 | 3,267 | 5 | 1 | 2,143 | Oklahoma State | 38 |
| 40 | North Dakota State | 601.17 | 3,607 | 6 | 1 | 1,529 | Minnesota | 51 |
| 41 | Michigan State | 597.00 | 3,582 | 6 | 1 | 1,540 | Michigan | 42 |
| 42 | Northern Illinois | 593.67 | 1,781 | 3 | 1 | 1,056 | Buffalo (B&B) | 54 |
| 43 | Bellarmine | 577.33 | 3,464 | 6 | 1 | 2,285 | Iowa | 31 |
| 44 | Edinboro | 565.33 | 3392 | 6 | 0 | 987 | Ohio State | - |
| 45 | American | 559.25 | 4,474 | 8 | 0 | 641 | Harvard | 60 |
| 46 | Stanford | 546.20 | 2,731 | 5 | 0 | 803 | Arizona State | - |
| 47 | Virginia | 527.57 | 3,693 | 7 | 1 | 1,152 | Duke | 23 |
| 48 | Northwestern | 520.50 | 3,123 | 6 | 0 | 846 | Minnesota | 36 |
| 49 | Franklin & Marshall | 475.00 | 1,900 | 4 | 0 | 600 | Binghamton | 44 |
| 50 | Navy | 456.40 | 2,282 | 5 | 0 | 504 | Bloomsburg | 24 |
| 51 | CSU Bakersfield | 379.00 | 1,895 | 5 | 0 | 477 | Cal Poly | - |
| 52 | Chattanooga | 372.40 | 1,862 | 5 | 0 | 476 | Indiana | 48 |
| 53 | Binghamton | 328.00 | 1,312 | 4 | 0 | 591 | Cornell | - |
| 54 | Ohio | 294.43 | 2,061 | 7 | 0 | 449 | Kent State | - |
| 55 | Air Force | 272.60 | 1,363 | 5 | 0 | 472 | North Dakota State | 52 |
| 56 | Campbell | 267.25 | 1,069 | 4 | 0 | 309 | Bellarmine | 47 |
| 57 | Duke | 254.88 | 2,039 | 8 | 0 | 436 | Gardner-Webb | 58 |
| 58 | Hofstra | 242.50 | 970 | 4 | 0 | 345 | Penn | 50 |
| 59 | Drexel | 182.86 | 1,280 | 7 | 0 | 267 | Princeton | 53 |
| 60 | Bloomsburg** | 148.80 | 744 | 7 | 0 | 206 | Rider | 46 |
| 61 | Kent State | 138.40 | 674 | 5 | 0 | 285 | SIU Edwardsville | 39 |
| 62 | Morgan State | 101.25 | 810 | 8 | 0 | 125 | Army West Point | - |
| Estimated Totals | ||||||||
| Gardner-Webb | 525 | 650 | Appalachian State | |||||
| Sacred Heart | 400 | |||||||
| VMI | 300 | |||||||
**- Denotes Incomplete Data.
Requested, did not provide: Clarion, LIU, Rider.
Did not track attendance: Brown, Bucknell, Buffalo, Columbia, Davidson, George Mason, Harvard, Presbyterian, SIU Edwardsville, The Citadel.
Asterisks & Caveats
Some schools ticketed for some events and not for others. Some schools provided numbers of counting fans despite not being ticketed, while others included only tickets sold and didn’t include free admission for students. Duals with numbers they were able to provide were included. Bloomsburg only provided home attendance data for five of its seven dates.
Methodology
Tracking the attendance figures varies by school, with some schools opting to ticket for some events and not ticket for others, making the numbers an imperfect science. This data is for dual meet events only, not tournaments hosted by schools. In all, 62 schools reported figures for 2024-25. Three schools provided estimated numbers, while 11 schools reported they did not track attendance for wrestling. California Baptist, while not tracking attendance this season, did track one dual with Indiana, which drew 1,932 fans. Brown, Bucknell, Buffalo, Columbia, Davidson, George Mason, Harvard, Presbyterian, SIU Edwardsville and The Citadel do not track attendance. Data was requested from Clarion, LIU and Rider but not received.
Every Power 4 school with wrestling reported attendance figures for the first time since tracking began in 2001-02.
Background
The National Wrestling Media Association assumed the role of collecting attendance figures in 2017. The late Denny Diehl of the Lehigh University Wrestling News began tracking attendance in 2002, with TheOpenMat.com’s Alex Steen handling compilation from 2015-2016.
Resources
A historical record of year-by-year figures can be found here: https://almanac.mattalkonline.com/college-wrestling-attendance/
A list of the all-time single college dual meets with over 10,000 fans can be found here: https://almanac.mattalkonline.com/college-wrestling-dual-meet-attendance-records/